Middle School Monday: Advocating in Pictures
I’m just going to say it: librarians are predisposed to be good at infographics. [Just bear with me through any crazy generalizations.] We’re wired to be good at information. Putting that information into an appealing, visual package—using a favorite digital tool—well, that should be simple, right?
Well, in a way.
We have tons of information—some of which we have to spit out at the end of the year for district, county, and/or state reports. Some of which we collect ourselves to allow for reflection on our own programming and collection development. We have pictures. We have lesson plans. Student testimonies. Artifacts. Circulation data. Videos. Blog posts. Student writing.
ADVERTISEMENT
ADVERTISEMENT
Funneling all of that data into a focused series of numbers and stories is difficult. We could write pages and pages. [Perhaps some of us have to.] I knew I wanted to produce *something* that demonstrated the tremendous growth our library experienced last year, but I didn’t want it to be a traditional report. I wanted to showcase students—and student reading. And, yes, honestly, I wanted to end my first year at a different school with the message that I had made a difference.
Isn’t that what we want our stakeholders—administrators, teachers, students, parents—to know? That we make a difference? That our time with students matters? That the funds that get funneled into our libraries that we then grow into engaging books and resources—that this matters?
I was lucky in my internship in so many ways as I worked with and learned from a wonderful librarian, Kristen Ziller. {She does amazing projects with her students! Follow her at @wavinglibrarian.} One of Kristen’s many strengths is her commitment to advocating for her library program—and (most importantly) backing it up with real data. Kristen’s was one of the first annual reports that I saw represented in an infographic—and I loved that idea. I know many of you are already doing this…and I wanted to jump on board.
My goal was to do this last June, but, um, that clearly did not happen. Doing it over the summer would’ve been nice. What a lovely piece to include during our first week of meetings. Um, no, didn’t make that either.
I just did it a few days ago. We’re already two weeks into this year. It’s late. I don’t care.
I used Canva and am happy with the end result. What I like most is the pictures. I can look at it in a glance and get a feel for the highlights of our year. I chose to only include three pieces of data to display. Do they put our year in a really good light? Well, of course. Are they accurate? Yes, of course! Then, why wouldn’t I have included them? We can’t be afraid to brag about our library programs. [If you’re curious about how those student check-outs improved so much? Flooding my collection with books that reflect my students, their lived experiences, and their interests.]
Is this infographic perfect? Gracious, no. I’m sure many of yours are much, much better. This, though, is the one I prefer for simple reasons. It includes my favorite quote. It includes those amazing students.
Maybe next year, I’ll even get it done on time.
I’d love to see how you advocate for your libraries and students in pictures! Have a great week!
Julie Stivers
@BespokeLib
Filed under: Middle School Monday
About Robin Willis
After working in middle school libraries for over 20 years, Robin Willis now works in a public library system in Maryland.
ADVERTISEMENT
ADVERTISEMENT
SLJ Blog Network
One Star Review, Guess Who? (#202)
This Q&A is Going Exactly As Planned: A Talk with Tao Nyeu About Her Latest Book
Exclusive: Giant Magical Otters Invade New Hex Vet Graphic Novel | News
Parsing Religion in Public Schools
ADVERTISEMENT

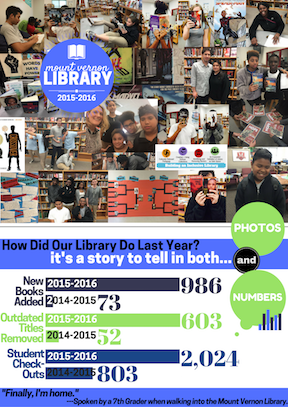


I should add that we have a very small school. Less than 100 students ~ just realized that the circulation data would look strange without being in context! Thanks! -Julie